Do you ever wonder about the best way to present research findings or other material that includes lots of business data?
Clients often ask me about this. How can you communicate large amounts of information clearly, concisely, and in an engaging way?
Here are three steps to take and four ways to present your data.
3 Steps To Prepare Your Data-Heavy Presentation
1. Analyze your audience
The first step with all presentations is to understand what your audience really needs and what communication style works best for them. How much of your research results or data is helpful? How familiar are they with the content and terminology?
2. Select the relevant data
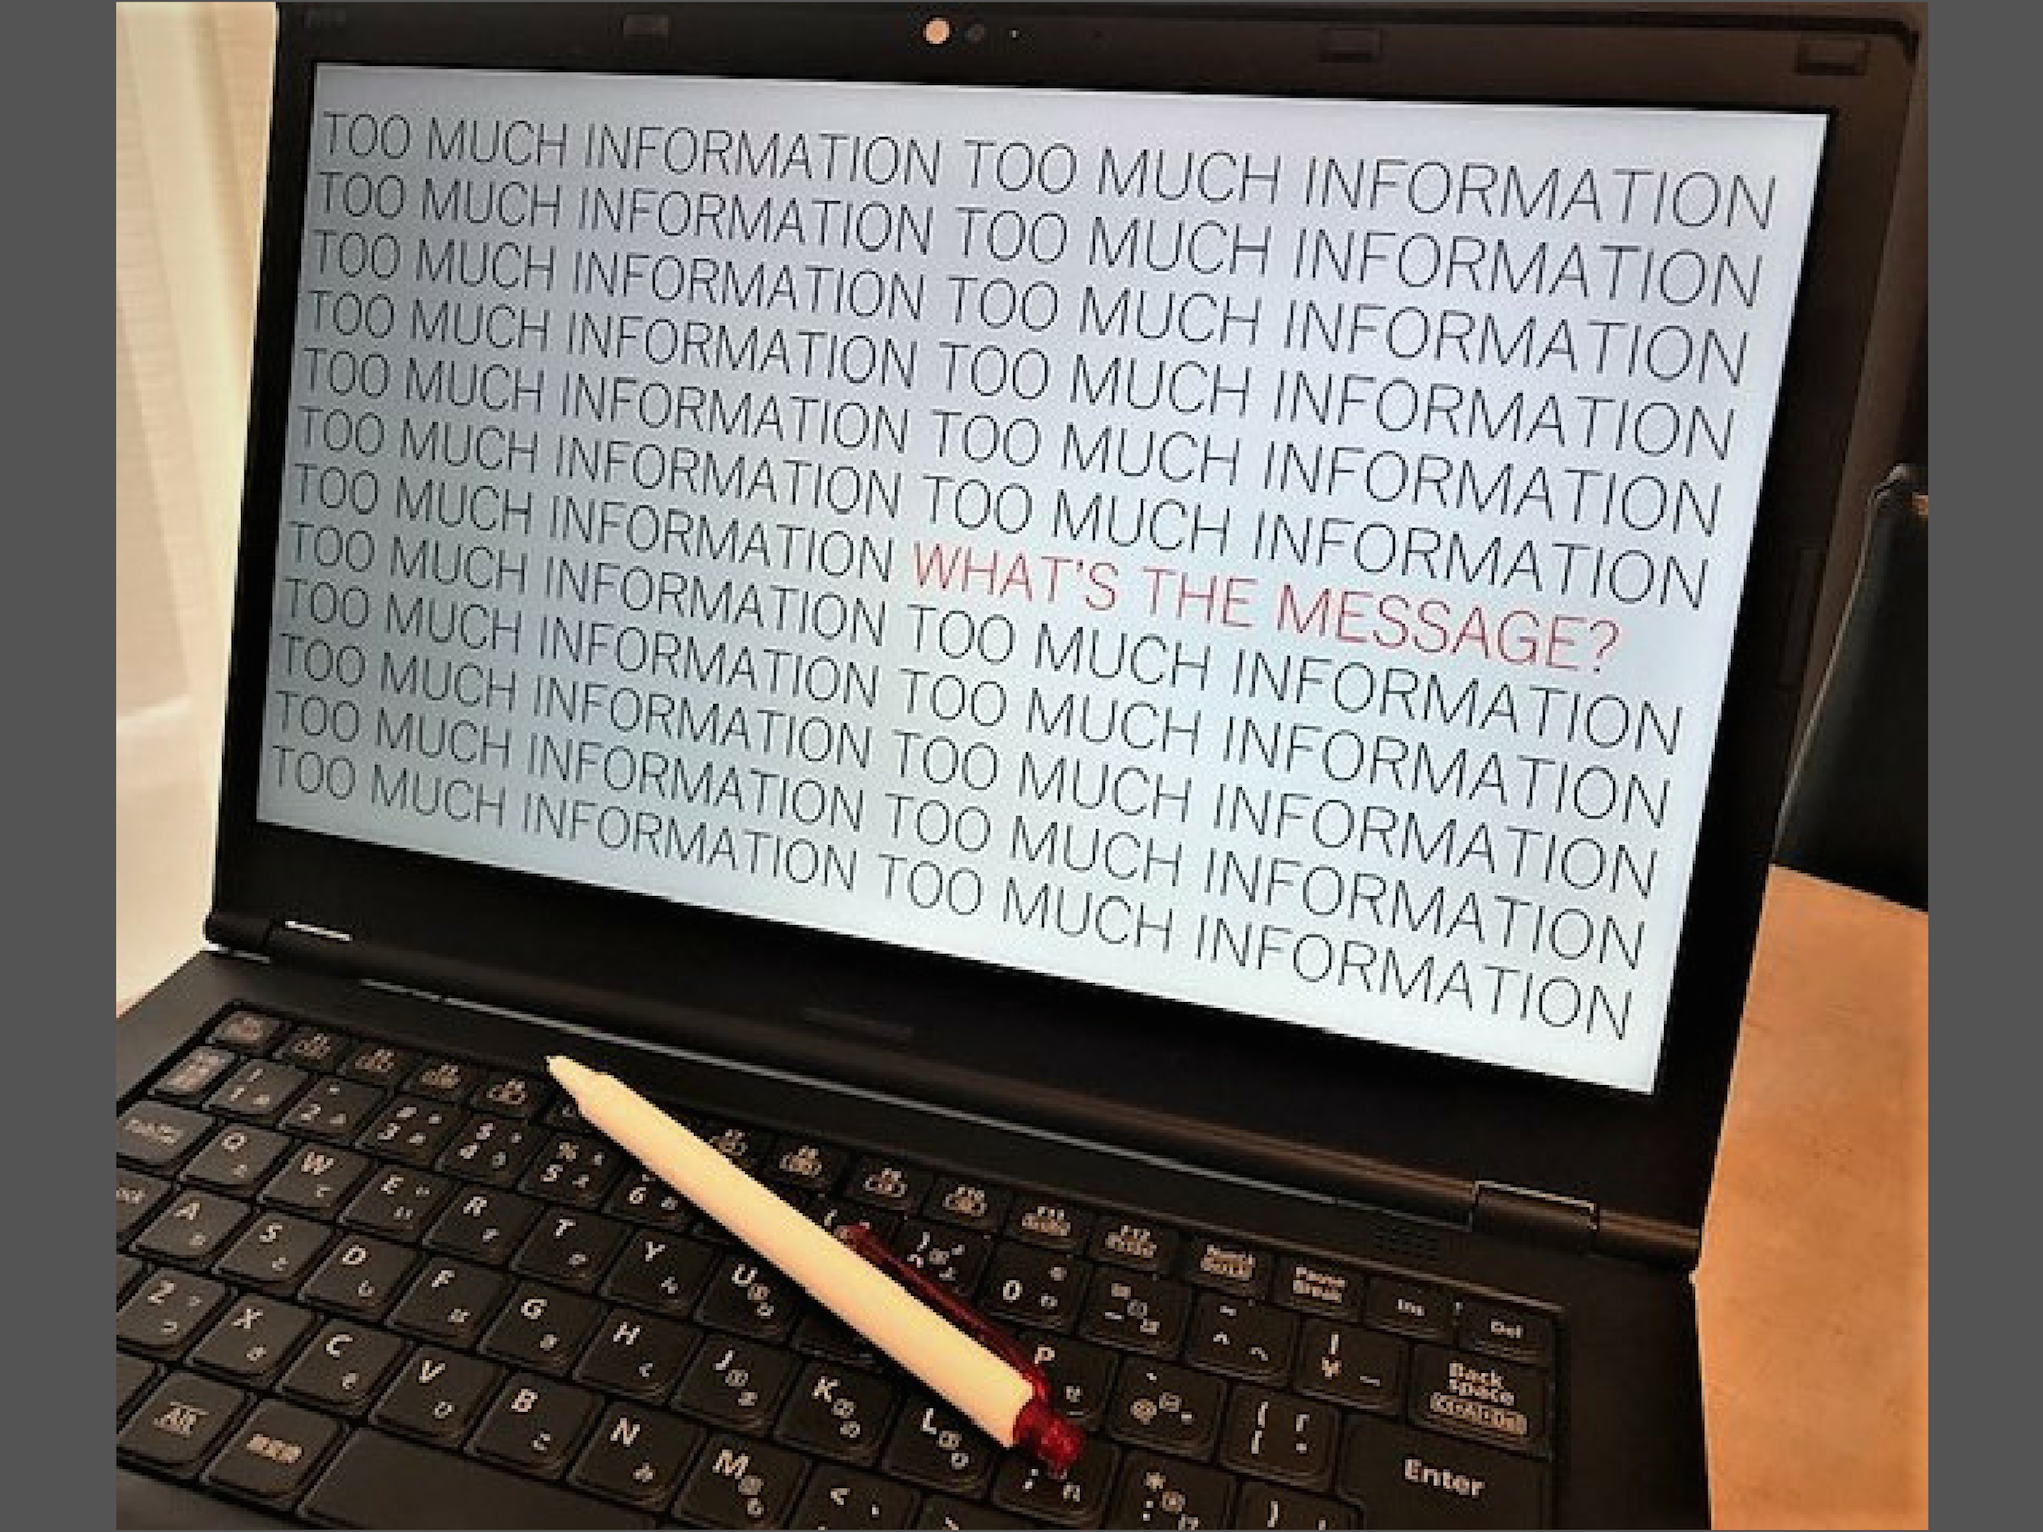
What data is best to deliver in the presentation and what might be useful in a handout or for you to refer to only if someone asks a question about it? As the presenter, you may want to be thorough and show all your hard work. Too much information is confusing for your audience. You may not realize this though if you have a polite audience, which is often the case in Japan!
3. Decide how to present the data
If you’re using slides to present your data, make sure that you have a logical transition from one slide to the next and that the message on each slide is clear. So often, I see a “data dump.” This is usually a table or list of data and even though the implications may be obvious to the presenter, the audience has to examine the data and attempt to work out what’s significant. Make it easy for your audience by highlighting what’s most important.
4 ways to present your research findings
PowerPoint isn’t the only option for presenting data. Consider these:
- Flip charts – I wrote about this option in the blog post How Many Slides Do You Need For A 30-minute Presentation?
- Gallery walk – Create large posters showing your key findings in images, charts, or simple text and have the audience walk around with you as you explain.
- Video – Play a short video that brings your findings to life.
- Physical objects – Show your audience physical objects related to your research. For example, one speaker compared a pingpong ball with a map of Kyushu to demonstrate the scale of accuracy of his technology.
I’d love to know what you use in your next presentation or any questions you have!
* * * * *

Are presentations important for your business – whether you’re talking with your client, speaking at a conference, or updating your team on a project?
Would you enjoy weekly tips, inspiration, and resources to build your communication skills and confidence for global business? I’m here to support you!
Subscribe to my free newsletter, Sasuga! Tips For You and I’ll pop into your email inbox every two weeks. Click here to join (I respect your privacy and you can easily unsubscribe at any time).